Published November 2021, African Energy presents a series of charts to help illustrate the continents's energy transition and the wider climate debate.
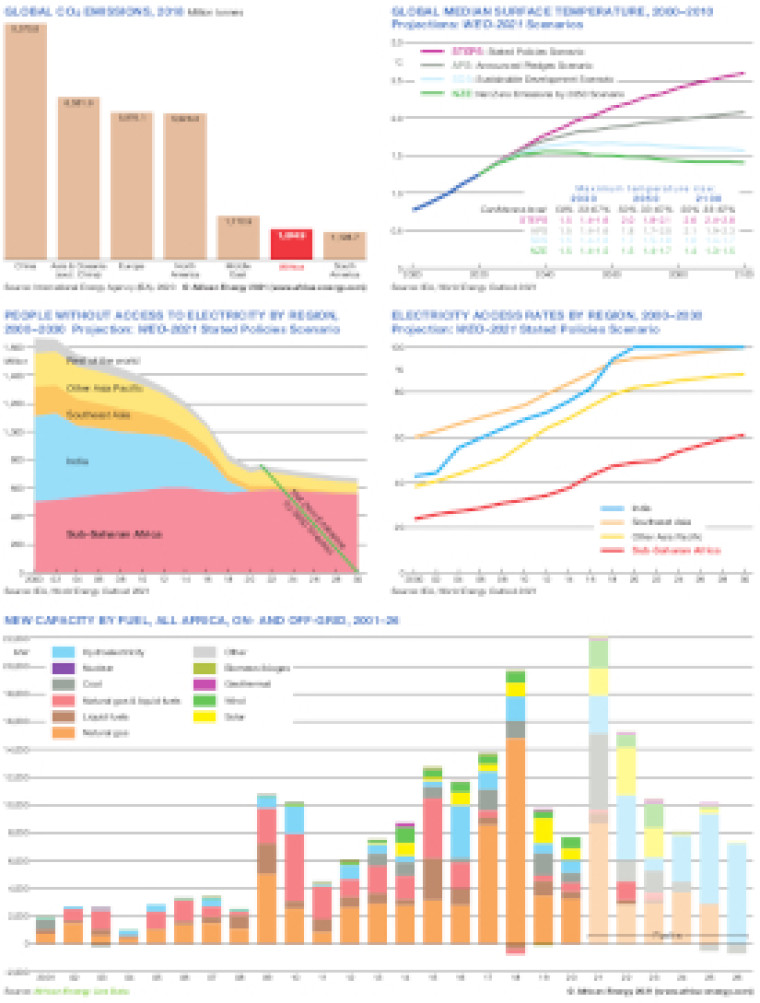
Drawing on African Energy Live Data, a trend chart for 2001-2026 shows new power generation capacity (on- and off-grid) additions by fuel.
This is supported by four small charts showing: Global CO2 emissions in 2018, global median surface temperature scenarios (2000-2100), People without access to electricity by region (2000-2030) and Electricity access rates by region (2000-2030).
The map is available as a PDF file using eps graphics, meaning that there is no loss of resolution as the file is enlarged.
Single African Energy map
£895
(1 standard map)
Subscribe to African Energy
African Energy is a brand of