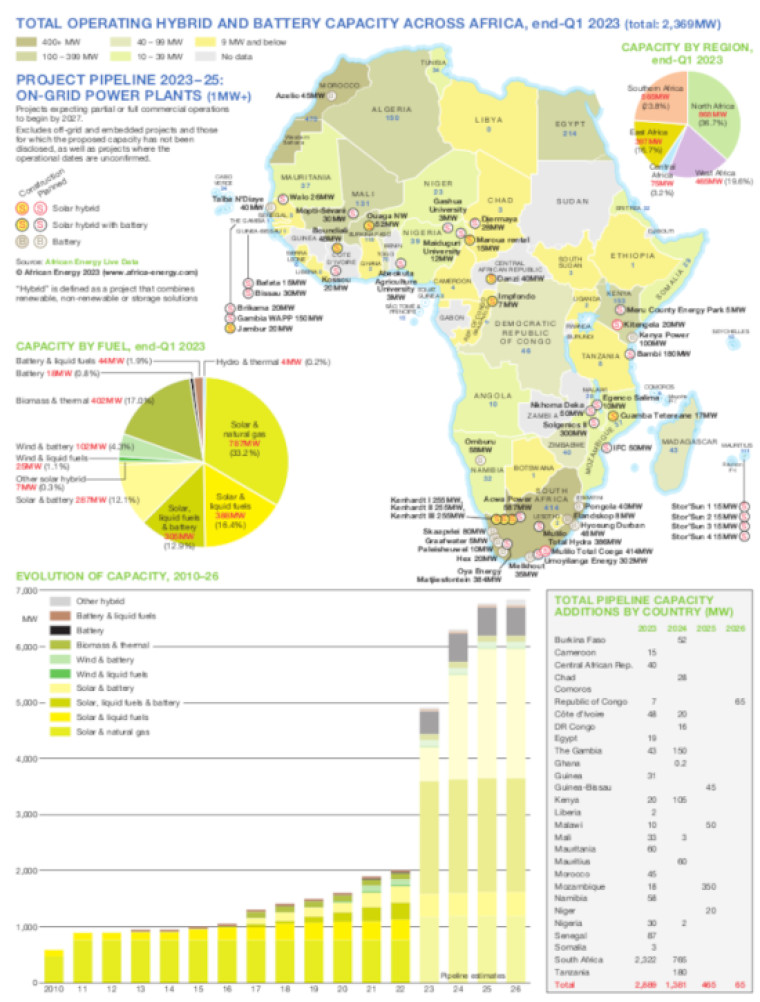
This graphic consists of a map and two charts illustrating the extent of total operating hybrid and battery capacity across Africa at the end of the first quarter 2023.
The map is shaded to show operating capacity, with projects expected to reach partial or full commissioning over the 2023-25 period marked. Off-grid and embedded projects are not included.
A pie chart shows a breakdown of total capacity by fuel, while a trend chart illustrates the evolution of capacity over 2010-22, with pipelines estimates for 2023-26.
A table displays total pipeline capacity additions by country.
Data was drawn from our African Energy Live Data platform, which contains project level detail on power plants and projects across Africa.
The downloadable file is a PDF using eps graphics, meaning that there is no loss of resolution as the file is enlarged.
Single African Energy map
£895
(1 standard map)
Subscribe to African Energy
African Energy is a brand of