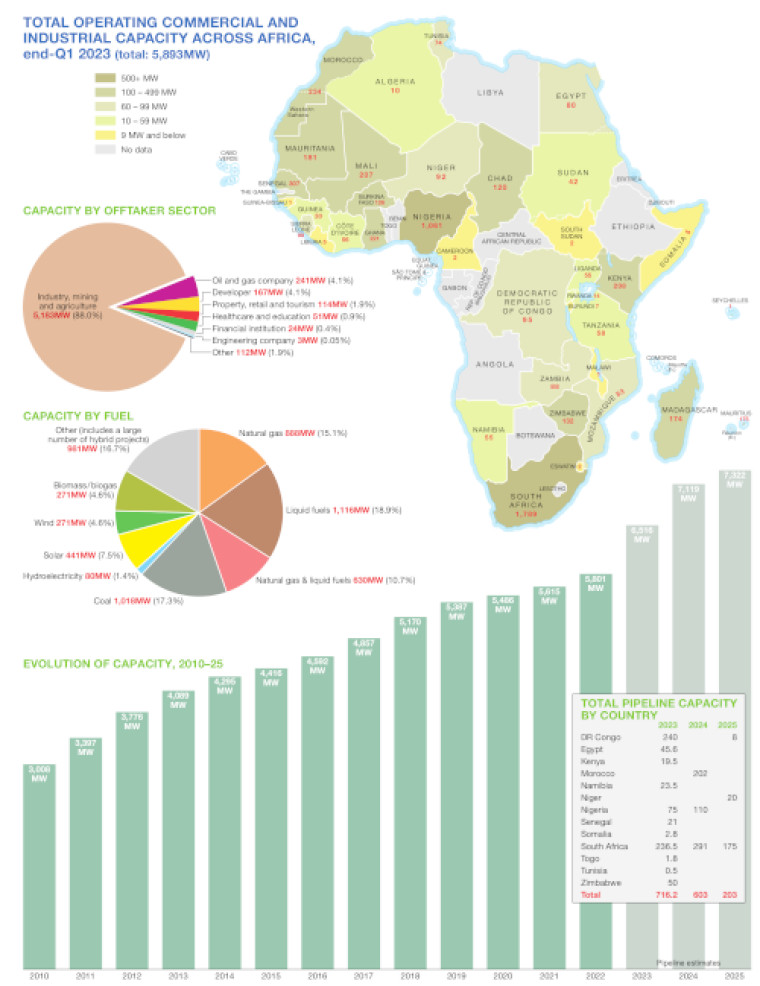
Published May 2023, this graphic combines a map and charts to illustrate the extent and evolution of commercial & industrial (C&I) power generation capacity across Africa.
A map of Africa is shaded to show total operating C&I capacity by country at the end of Q1 2023. Two pie chats show capacity by offtaker sector and capacity by fuel. A bar chart shows the evolution of C&I capacity from 2010 to 2023, with pipeline estimates for 2023-2025.
Data was drawn from our African Energy Live Data platform, which contains project level detail on power plants and projects across Africa.
The map is presented as a PDF file using eps graphics, meaning that there is no loss of resolution as the file is enlarged.
Single African Energy map
£895
(1 standard map)
Subscribe to African Energy
African Energy is a brand of