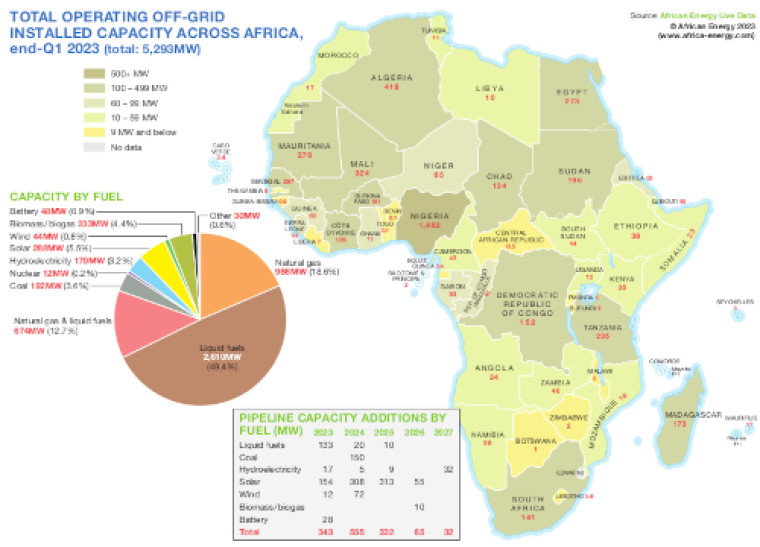
This graphic consists of a map, pie chart and table illustrating total operating off-grid installed capacity across Africa at the end of the first quarter 2023.
The map is shaded to show operating capacity while the pie provides breakdown by fuel type.
The table displays pipeline capacity additions by fuel for the 2023-27 period.
Data was drawn from our African Energy Live Data platform, which contains project level detail on power plants and projects across Africa.
The downloadable file is a PDF using eps graphics, meaning that there is no loss of resolution as the file is enlarged.
Single African Energy map
£895
(1 standard map)
Subscribe to African Energy
African Energy is a brand of