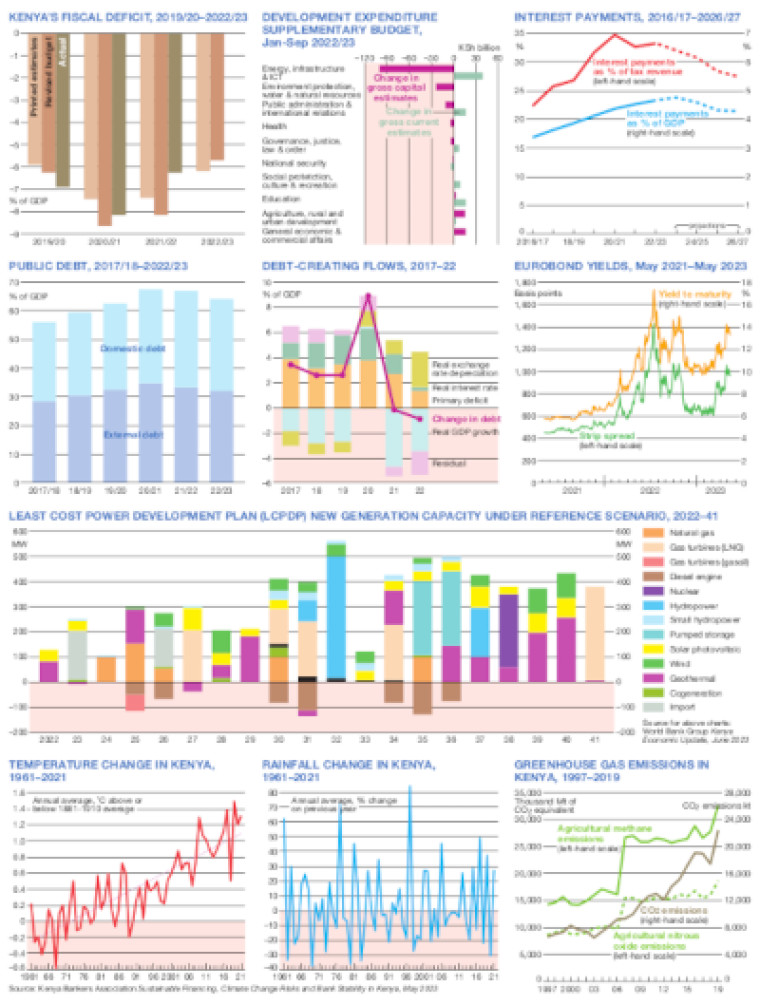
Published October 2023, this graphic consists of a series of charts illustrating key economic, debt and climate change indicators.
Two bar chart show Kenya's fiscal deficit and public debt trends , with a third chart showing debt-creating flows for the 2017-2022 period. Line charts illustrate trends for interest payments and Eurobond yields.
A World Bank Group trend chart for 2022-2041 illustrates least cost power development plan new generation capacity under reference scenario.
Three small climate trend charts for Kenya show temperature changes (1961-2021), rainfall changes (1961-2021) and greenhouse gas emissions (1197-2019).
Data for the charts was sources from the World Bank Group's Kenya Economic Update (June 2023) and the Kenya Bankers Association Sustainable Financing, Climate Change Risks and Bank Stability report (May 2023)
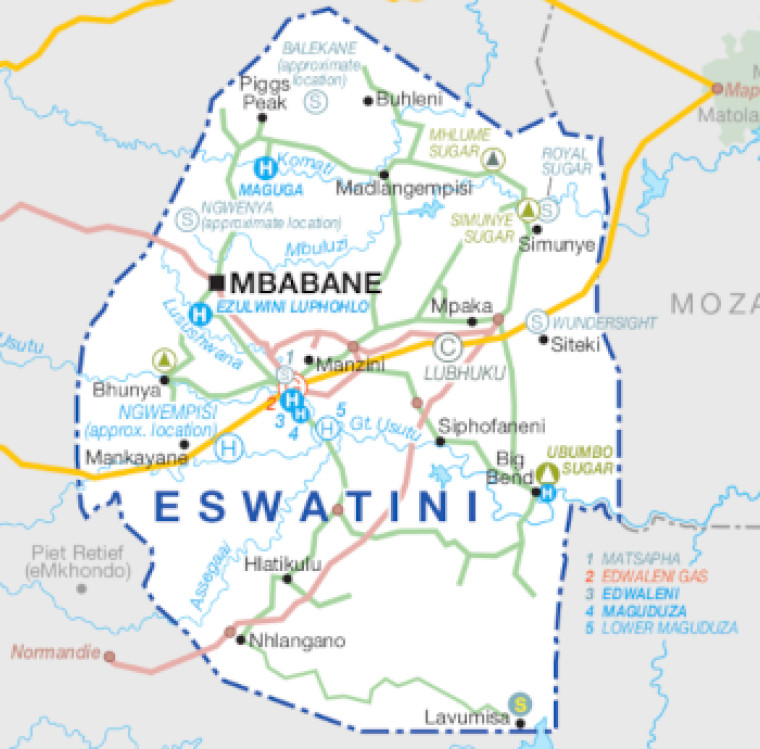
Single African Energy map
£895
(1 standard map)
Subscribe to African Energy
African Energy is a brand of