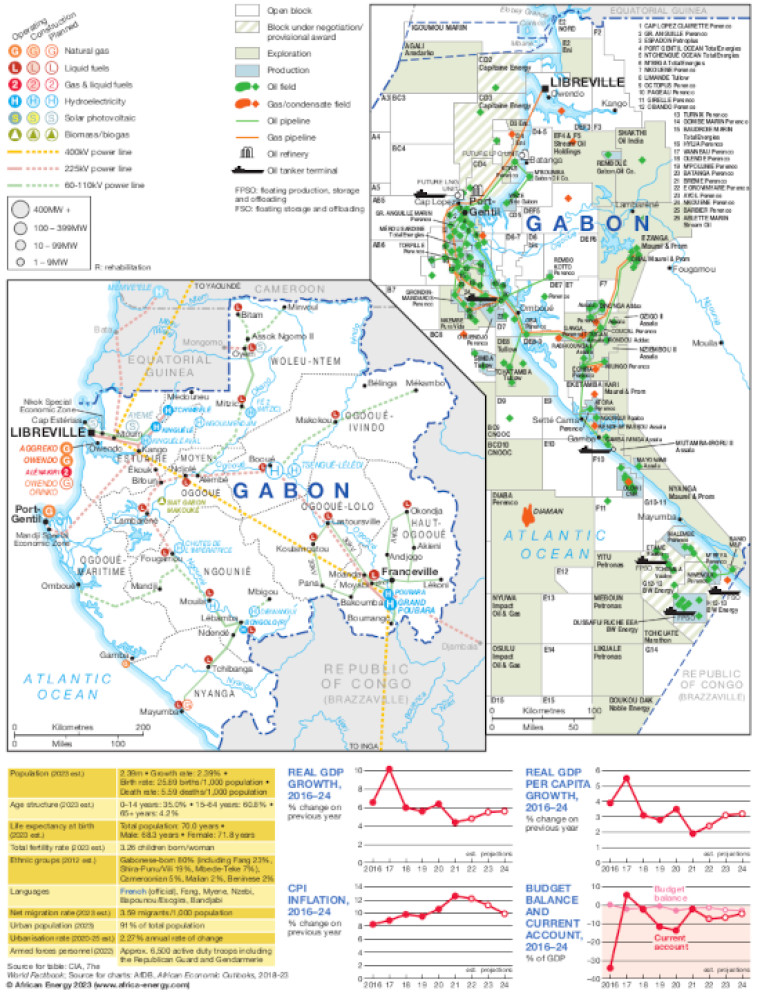
Published in September 2023, this one-page map provides a detailed view of the energy sector in Gabon, with separate maps for power infrastructure and oil and gas activity.
A small panel provides basic information on population demographics, while four small trend charts for 2016-2024 show real GDP growth, real GDP per capita growth, CPI inflation, and budget balance plus current account.
The power map shows the locations of generation facilities that are operating, under construction or planned. Plants are shown by type – including liquid fuels, gas and liquid fuels, natural gas, hydroelectricity, solar PV and biomass/biogas.
Generation sites are marked with different sized circles to show sites of 1-9MW, 10-99MW, 100-399MW and 400MW and above.
Existing and future transmission and distribution lines are shown ranging from 60kV to 400kV. Actual and planned cross-border interconnectors are also shown including lines to Equatorial Guinea and Republic of Congo.
Power generation data was drawn from our African Energy Live Data platform, which contains project level detail on power plants and projects across Africa.
The oil and gas map shows blocks that are open and those that are under application or where a provisional award has been granted. Licensed acreage is shaded to show exploration and production blocks, with block operators and oil and gas fields marked. Associated mid- and downstream infrastructure is shown such as oil and gas pipelines, tanker terminals, refineries and the location of FPSO and FSOs.
The map is presented as a PDF file using eps graphics, meaning that there is no loss of resolution as the file is enlarged.
Single African Energy map
£895
(1 standard map)
Subscribe to African Energy
African Energy is a brand of