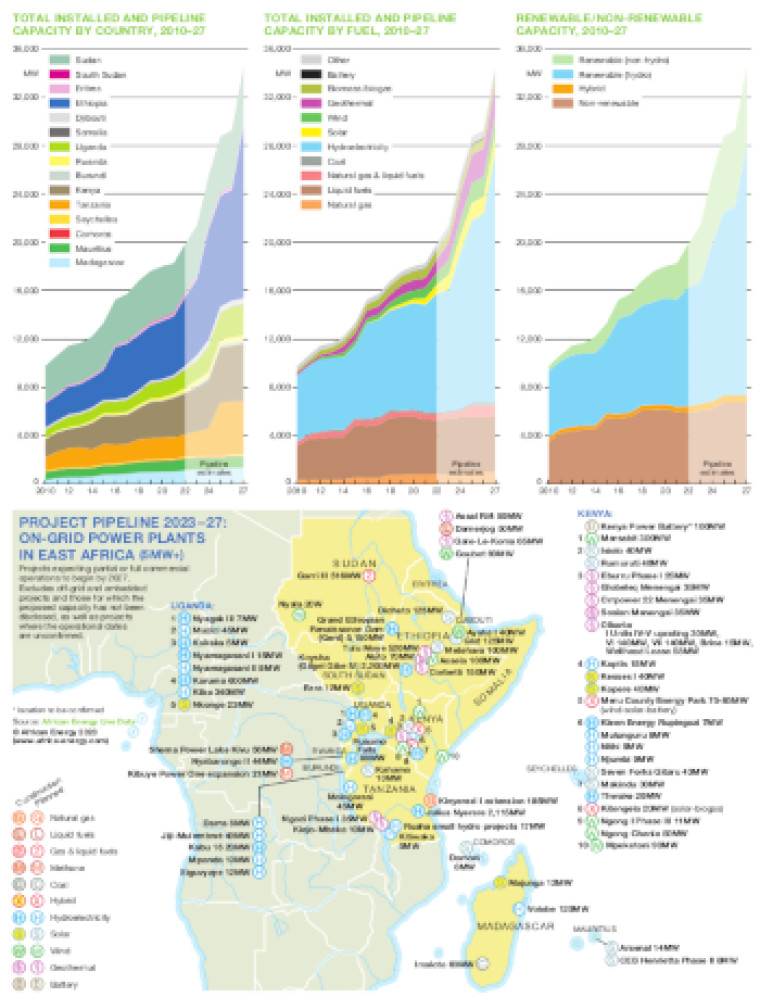
Published February 2023, this graphic consists of three trend charts illustrating East Africa's installed and pipeline power generation capacity and a map showing the location of generation projects where commercial operations are scheduled to begin over the 2023-2027 period.
Data for the charts and map is drawn from African Energy Live Data, a power database with detailed profiles of more than 7,000 power generation plants and projects across Africa and the entities behind them.
The three charts show total installed and pipeline capacity by country (2010-27), total installed and pipeline capacity by fuel (2010-27) and renewable/non-renewable capacity (2010-27).
The map shows named projects of 5MW-plus, with locations marked by fuel type and whether they are currently under construction or planned.
Single African Energy map
£895
(1 standard map)
Subscribe to African Energy
African Energy is a brand of