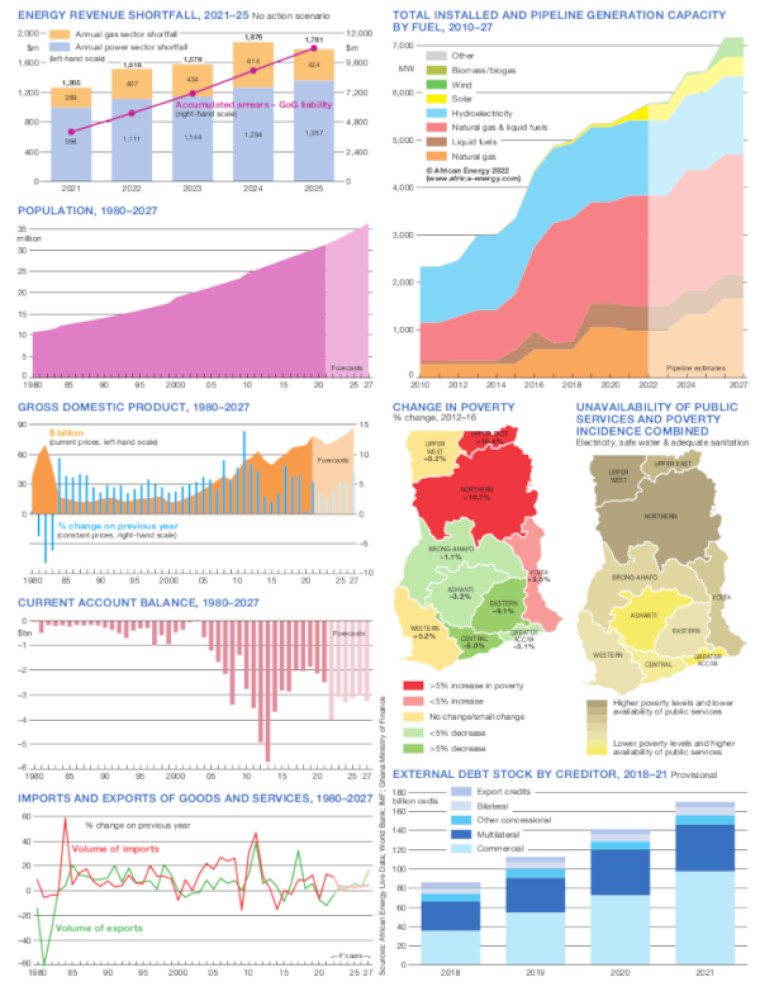
Revised October 2023, this one page PDF collects together a range of charts illustrating key economic and energy industry data for Ghana.
The trend charts cover energy revenue shortfall (2021-25), population growth (1980-28), GDP, external debt stock by creditor, current account balance and imports and exports of goods and services.
A power trends map for 2010-27 shows total installed and pipeline generation capacity by fuel- data for this chart is drawn from our African Energy Live Data platform.
Two small shaded maps illustrate by province, changes in poverty from 2012-2016 and the unavailability of public services and poverty incidence combined.
Data is drawn from African Energy Live Data, World Bank, IMF and Ghana's Ministry of Finance.
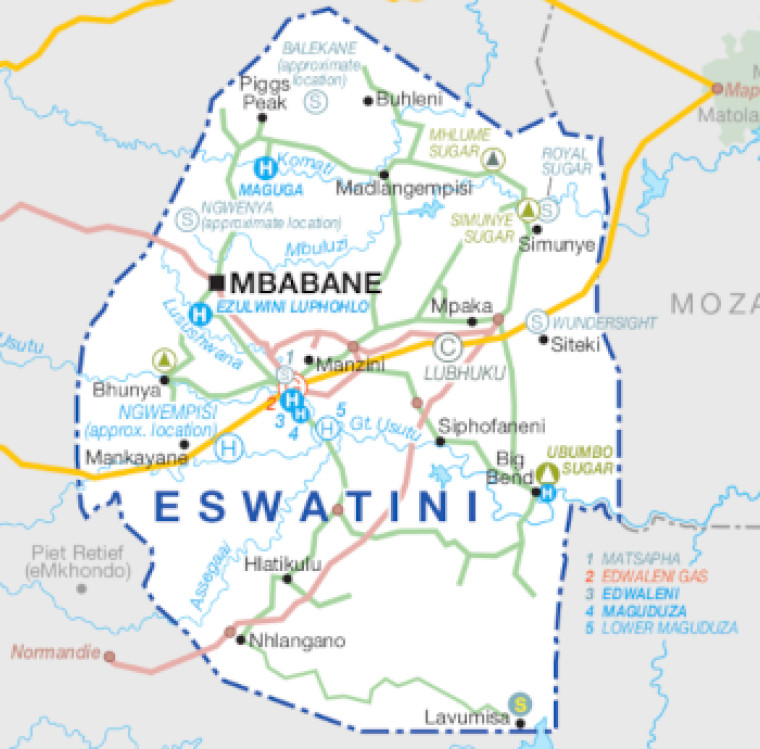
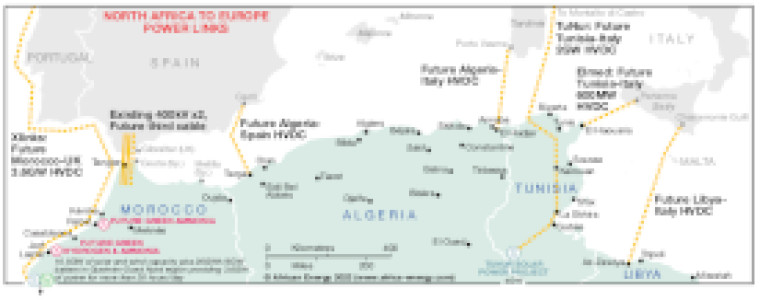
Single African Energy map
£895
(1 standard map)
Subscribe to African Energy
African Energy is a brand of