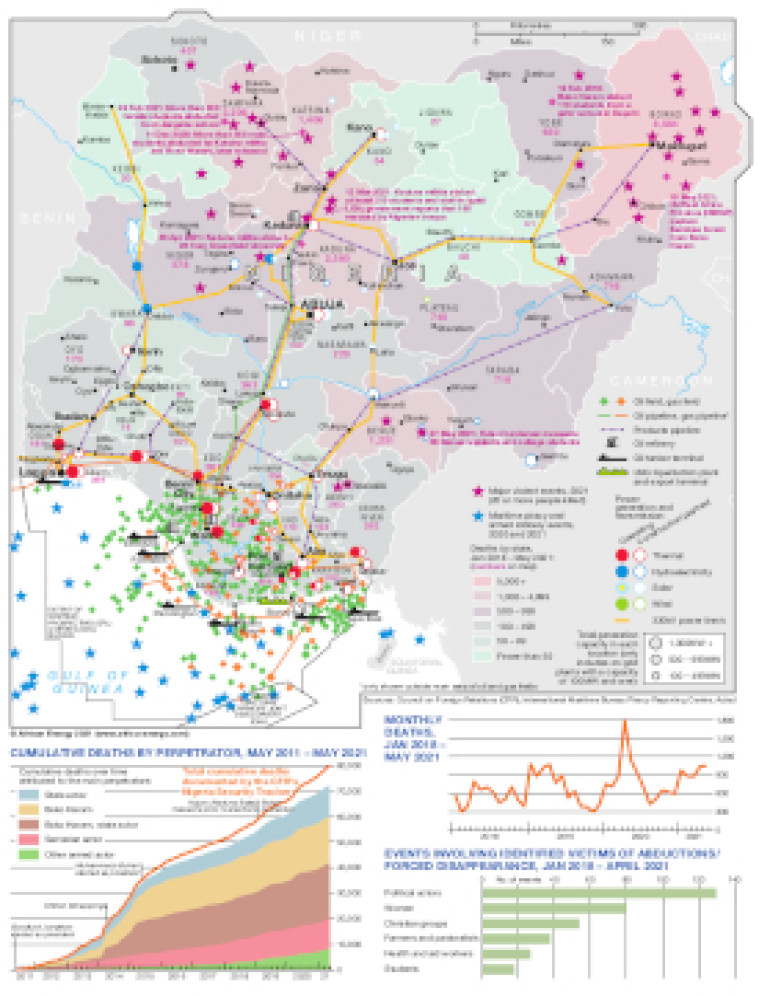
This map provides an overview of security flash points across Nigeria alongside the location of major energy infrastructure, including power generation sites, oil and gas fields, pipelines and tanker terminals.
Major violent events during 2021 are marked as well as maritime piracy and armed robbery events recorded in 2020 and the year to early June 2021. States are shaded to show the number of deaths over the period January 2018-May 2021.
Three charts at the bottom of the map show: cumulative deaths by perpetrator (May 2011-May2021), monthly deaths (Jan 2018-May 2021), and events involving identified victims of abductions/forced disappearance (Jan 2018-April 2021).
The map is available as a PDF file using eps graphics, meaning that there is no loss of resolution as the file is enlarged.
Single African Energy map
£895
(1 standard map)
Subscribe to African Energy
African Energy is a brand of