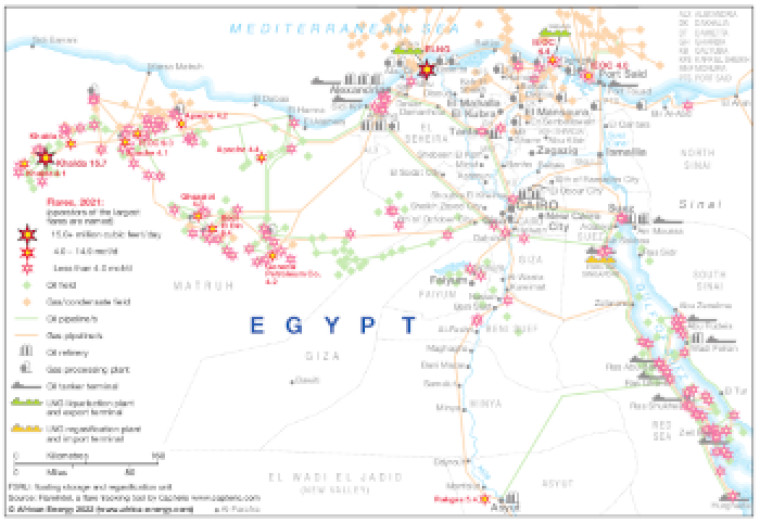
Published December 2022, this map illustrates the extent of Egypt's gas flaring problem. Based on data from Flareintel, the map shows the location of gas fields where flaring took place in 2021 and the rate of gas flaring in million cubic feet/day. Operators of the largest flares are named.
The map also shows associated hydrocarbons infrastructure including oil fields, pipelines refineries, gas processing plants ad LNG facilities
The map is presented as a PDF file using eps graphics, meaning that there is no loss of resolution as the file is enlarged.
Single African Energy map
£895
(1 standard map)
Subscribe to African Energy
African Energy is a brand of