Published November 2021, African Energy presents two pages of charts illustrating the state of Africa's power generation sector at the end of H1 2021.
The data for the charts is drawn from African Energy Live Data, which contains project level detail on more than 6,700 power plants and projects across Africa.
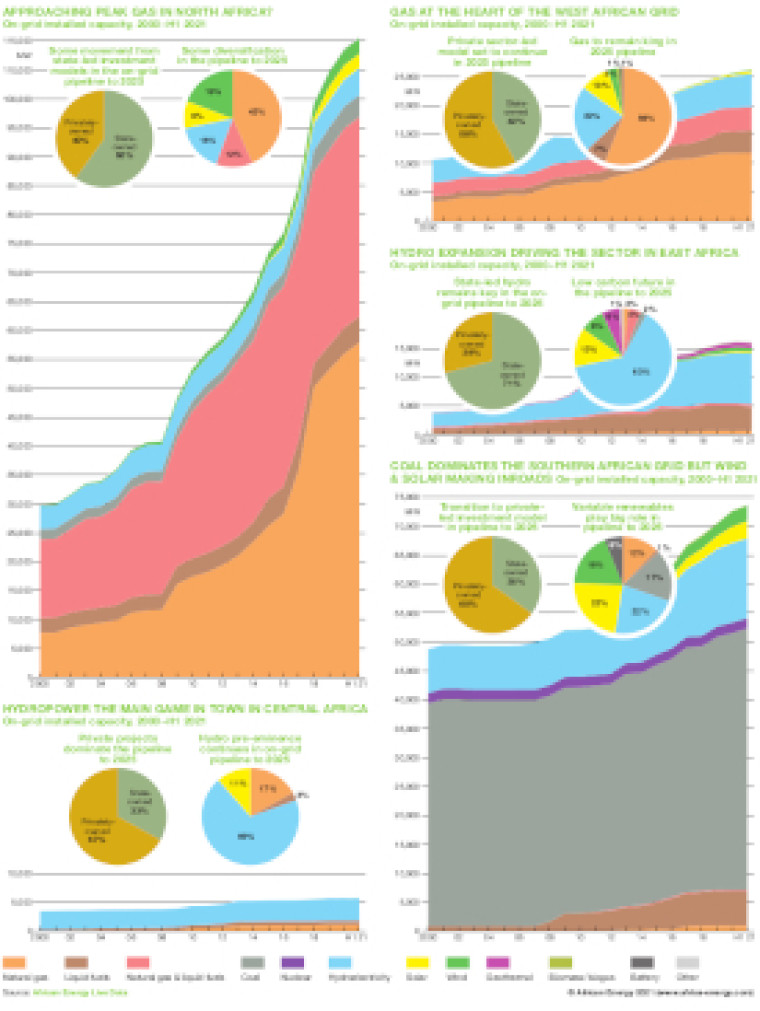
The first page examines the changing regional energy mix across the continent. Alongside trend charts showing the on-grid installed capacity from 2000-H1 2021, a series of small pie charts provide insights on the balance of privately-owned and state-owned projects in each region and a percentage breakdown of the regional energy mix by main fuel types.
Page two includes pie charts illustrating on-grid power capacity additions in H1 2021 for the continent and sub-Saharan Africa, plus two pie charts showing the on-grid installed capacity mix by fuel at the end of June 2021 for all Africa and sub-Saharan Africa.
Two additional charts show on-grid asset ownership for all Africa over 2000-H1 2021 and off-grid and embedded capacity additions from 2010-H1 2021.
The charts are presented as a PDF file using eps graphics, meaning that there is no loss of resolution as the file is enlarged.
Double African Energy map
£950
(1 two-page map)
Subscribe to African Energy
African Energy is a brand of