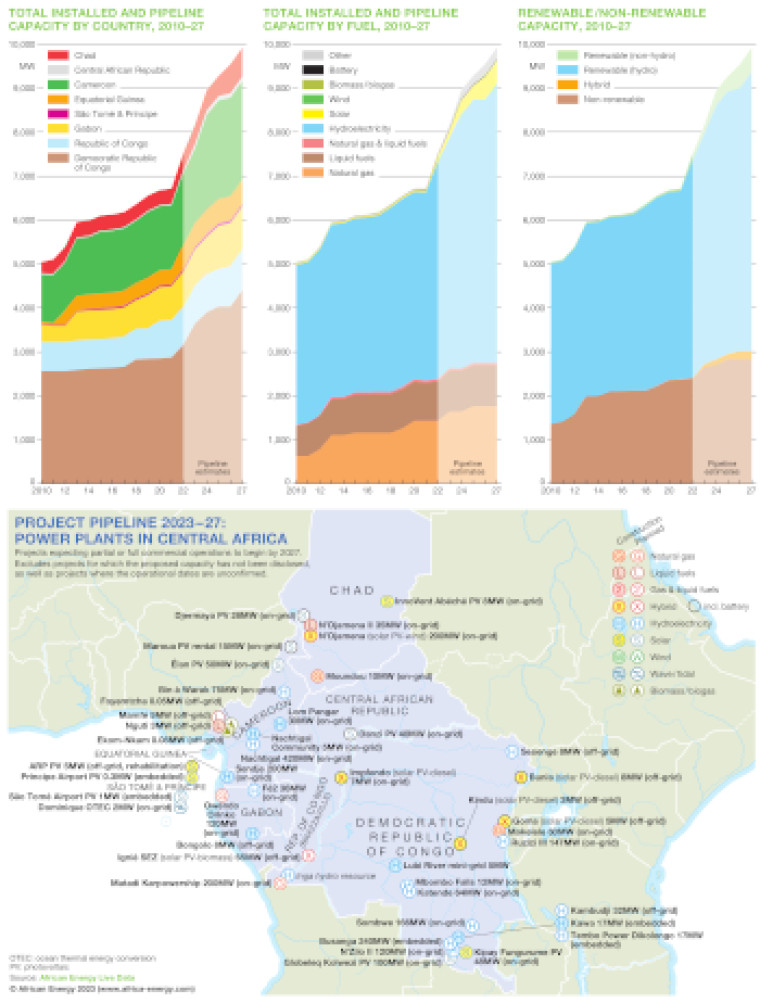
Published March 2023, this graphic consists of three trend charts illustrating Central Africa's installed and pipeline power generation capacity and a map showing the location of generation projects where partial or full commercial operations are scheduled to begin over the 2023-2027 period.
Data for the charts and map is drawn from African Energy Live Data, a power database with detailed profiles of more than 7,000 power generation plants and projects across Africa and the entities behind them.
The three charts show total installed and pipeline capacity by country (2010-27), total installed and pipeline capacity by fuel (2010-27) and renewable/non-renewable capacity (2010-27).
The map, which covers Cameroon, Central African Republic, Chad, Democratic Republic of Congo, Equatorial Guinea, Gabon and the Republic of Congo, shows named projects where proposed capacity is known and targeted commercial operations dates have been confirmed. Project locations are marked by fuel type and whether they are currently under construction or planned.
The map is presented as a PDF file using eps graphics, meaning that there is no loss of resolution as the file is enlarged.
Single African Energy map
£895
(1 standard map)
Subscribe to African Energy
African Energy is a brand of