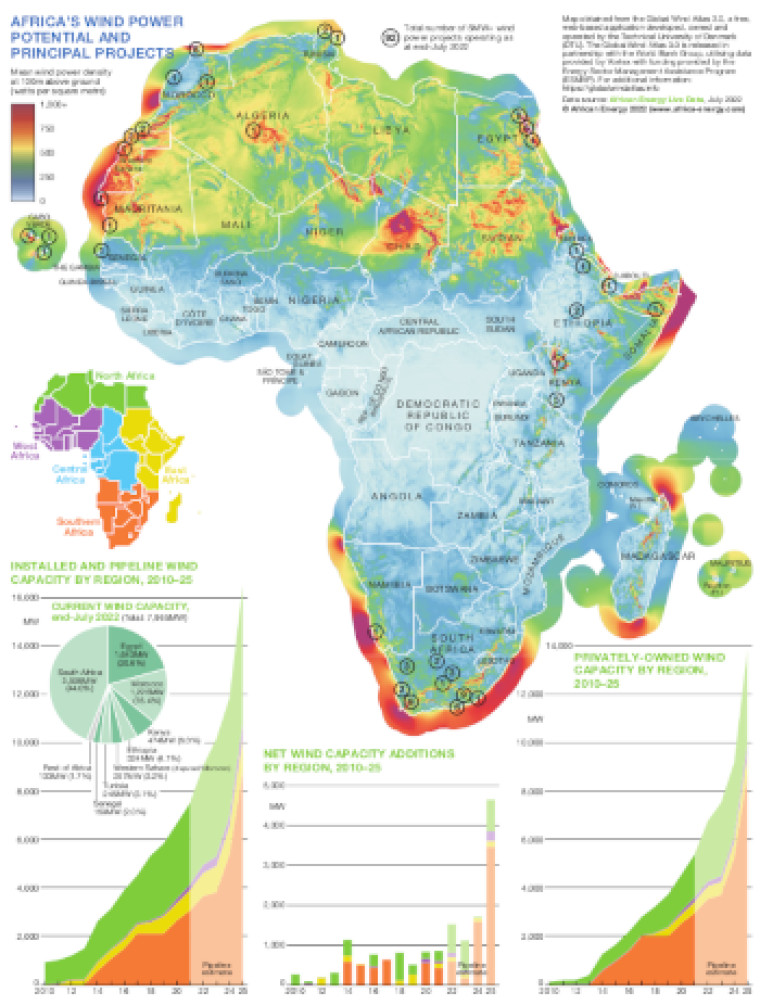
This map use datasets from African Energy Live Data to illustrate Africa's wind power potential and principal projects.
The map is shaded to show mean wind power density at 100m above ground, while major wind power generation plants and projects across the continent are marked. Below the map are three African Energy Live Data trend charts for 2010-2025, showing installed and pipeline wind capacity by region, net wind capacity additions by region and privately owned wind capacity by region.
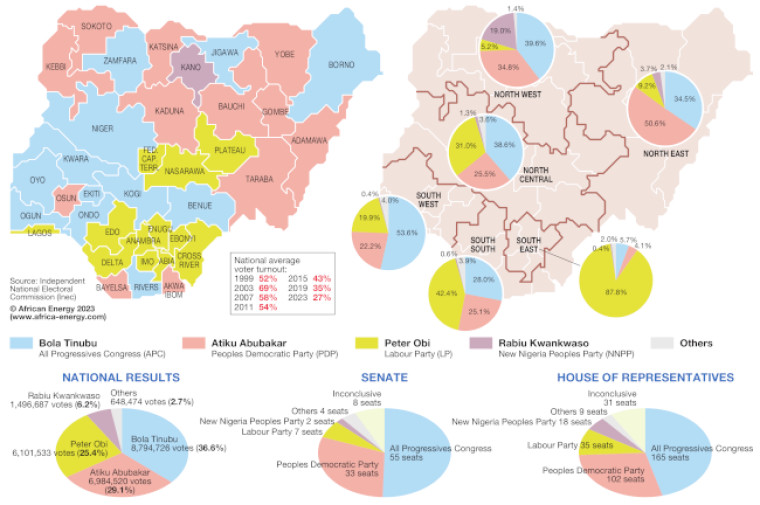
Single African Energy map
£895
(1 standard map)
Subscribe to African Energy
African Energy is a brand of