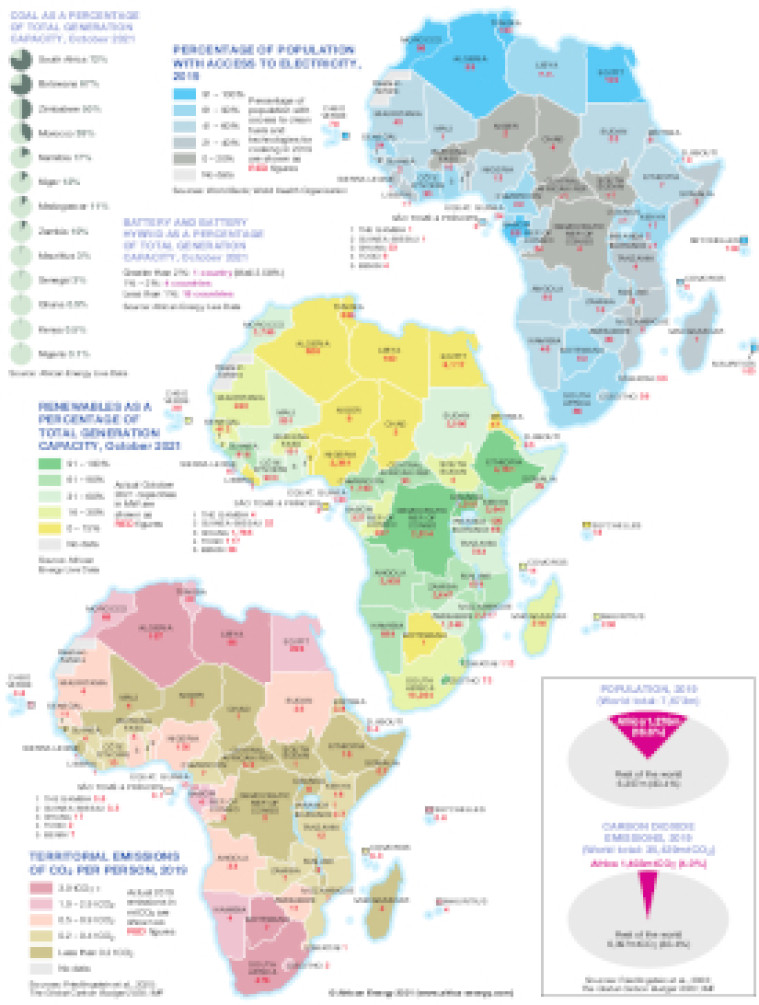
Published November 2021, this map illustrates a series of key datasets that provide context to Africa's energy transition and its contribution to current CO2 emissions.
Two maps show country-by-country access to electricity rates and CO2 emissions (actual and per capita). A third map uses African Energy Live Data's power database to provide a country-by-country picture of renewables power generation capacity and renewables as a percentage of total generation capacity.
A line of small pies shows coal generation as a percentage of total generation capacity, with South Africa (72%), Botswana (67%) and Zimbabwe (50%) the largest coal power users.
An inset of two pie charts shows Africa's proportion of world population compared to its contribution to world CO2 emissions.
The map is available as a PDF file using eps graphics, meaning that there is no loss of resolution as the file is enlarged.
Single African Energy map
£895
(1 standard map)
Subscribe to African Energy
African Energy is a brand of