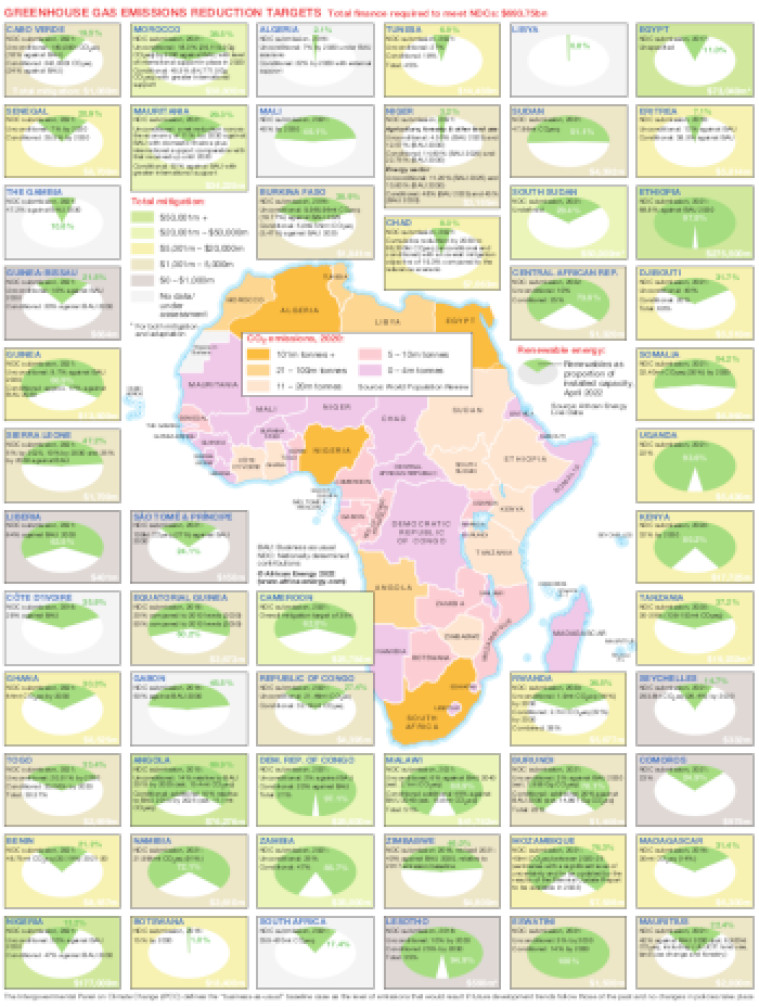
Published April 2022, this graphic provides a country-by-country examination of Africa's greenhouse gas emissions reduction targets. A central map shows the countries of Africa shaded according to their 2020 CO2 emissions. Around the outside of the map, boxes for each country show a pie chart illustrating renewable energy as a proportion of installed capacity in April 2022 (data sourced from African Energy Live Data) plus data on 2021 nationally determined contributions for a reduction in greenhouse gas emissions. The country boxes are shaded to show assessment of finance required, with totals (where available) noted in the bottom right of each box.
The graphic is available as a PDF file using eps, meaning that there is no loss of resolution as the file is enlarged.
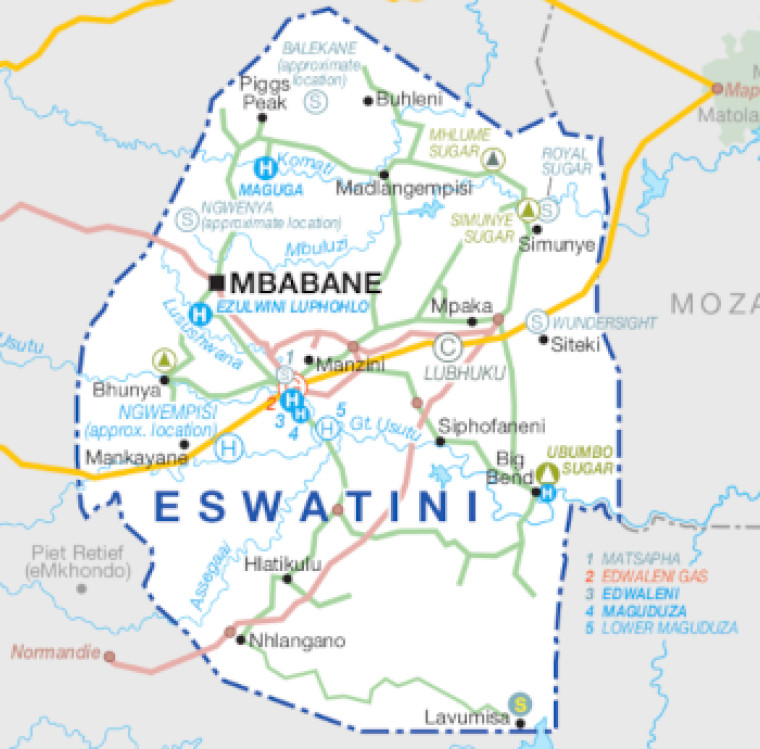
Single African Energy map
£895
(1 standard map)
Subscribe to African Energy
African Energy is a brand of